Creating Ads Account run by Virteom
Google Data Studio Reporting
Google Data Studio Reporting
Google Data Studio
Virteom utilizes Google Data Studio for multiple purposes. It has been used for Google Analytics data reporting, and is still used for Google Ads data reporting as well as Callrail data. Primarily Virteom uses it to analyze our performance and we send Clients this data so that they can see what our services have provided them.
To get started it is required that you are logged into "virteomads1@gmail.com," this is the email Virteom uses for Google Ads, as well as Data Studio Reporting.
To view all of Google Data Studio follow this link: https://datastudio.google.com/
It is recommended that you bookmark any links in this document.
The layout of Google Data Studio appears as follows (as of September 20th, 2022):
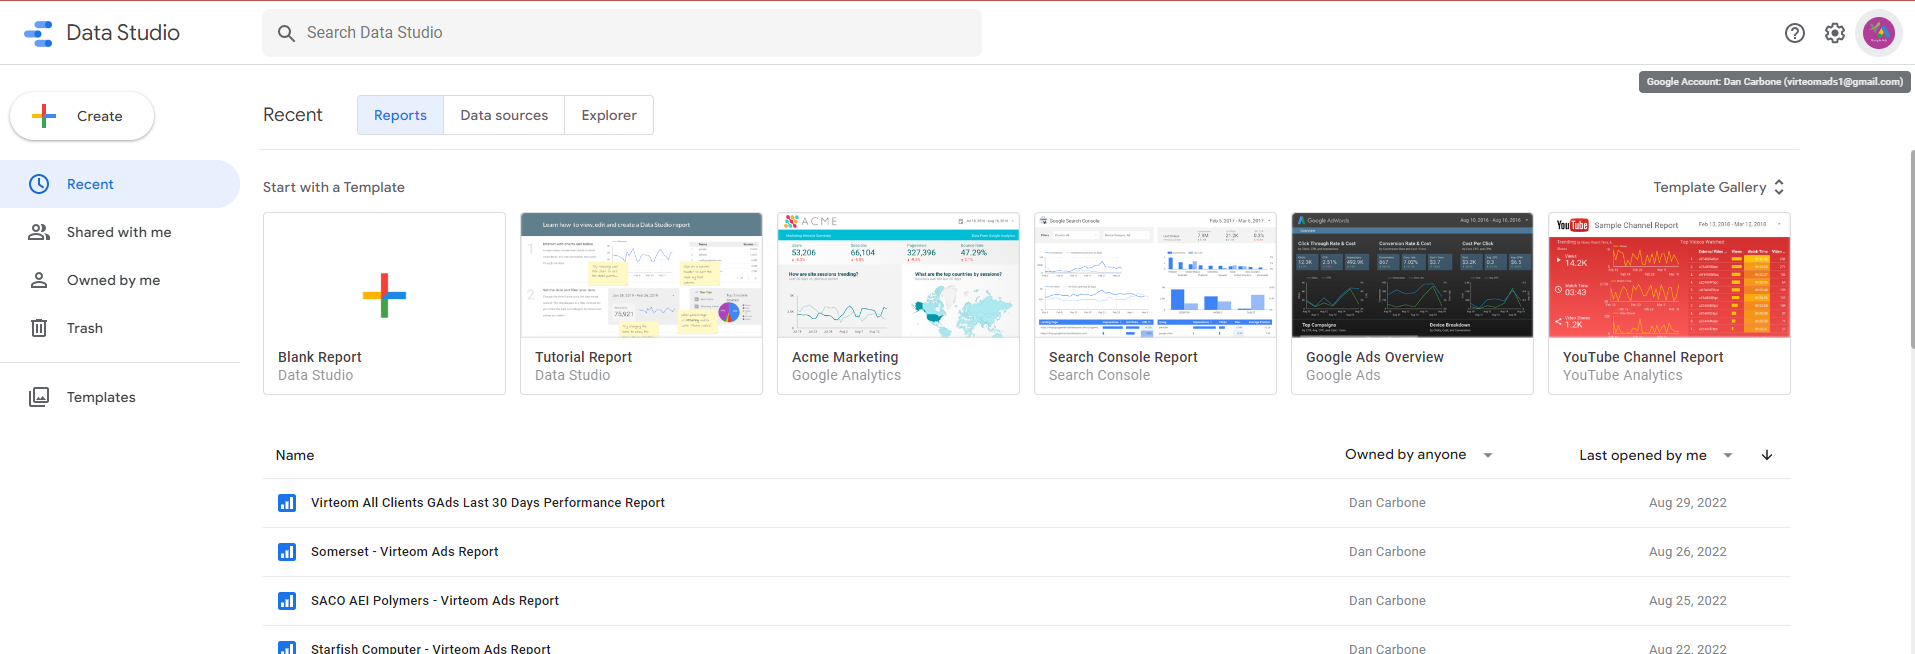
If you are familiar with the Google Suite the layout should make sense.
However if you are unaware, the most notable points of the layout are the menues located at the top and left as well as the list of reports roughly half-way down the webpage.
Menues
There are two menues on the main page. This document will describe the top menu shown below. This menu allows you to access the different aspects that Data Studio manages.
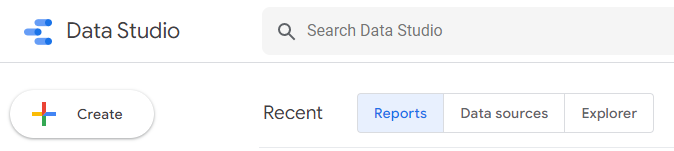
The "Create" button prompts the user to create a Report, Data source, or Explorer. Currently Virteom duplicates out reports, so it may only be necessary to utilize this button when you create a Data Source.
The tabs labeled: " Reports", "Data sources", and "Explorer" allow you to navigate betweeen the reports that Virteom creates, and the data sources that Virteom utilizes. The third tab labeled "Explorer" is currently not in-use.
Adding a Data Source
(for Ad performance reporting)
From the dashboard of Google Data Studio:
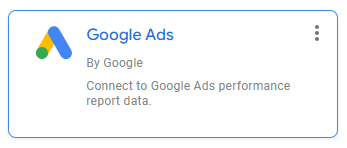
- Click "Create" and select "Data Source"
- Select the "Google Ads" option
- Depending on how we manage the ads for the client, typically a client that we manage within Virteom's Ad account will have a similar roadmap to this:
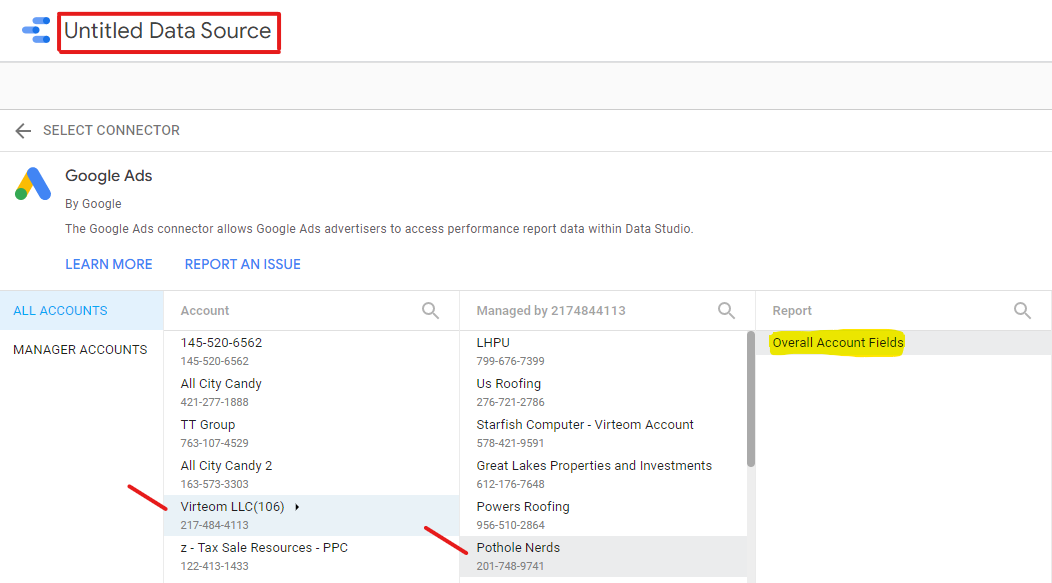
- In the image above, note the red-bordered box. You can click into the title and rename the Data Source to identify it at a later point in time.
- Once you have properly named your Data Source, you can press the blue button that says "connect" in the top right.
- Once you see the fields page the Data Source will be available in Google Data Studio to use.
All Clients Report
The Following link will take you to the Data Studio Report titled, "Virteom All Clients GAds Last 30 Days Performance Report."
It can be found at this link: https://datastudio.google.com/reporting/fea20a27-3742-4096-a8ed-364531188de0/page/JWrbB
This report is a great tool for managing ads once you understand how to read it.
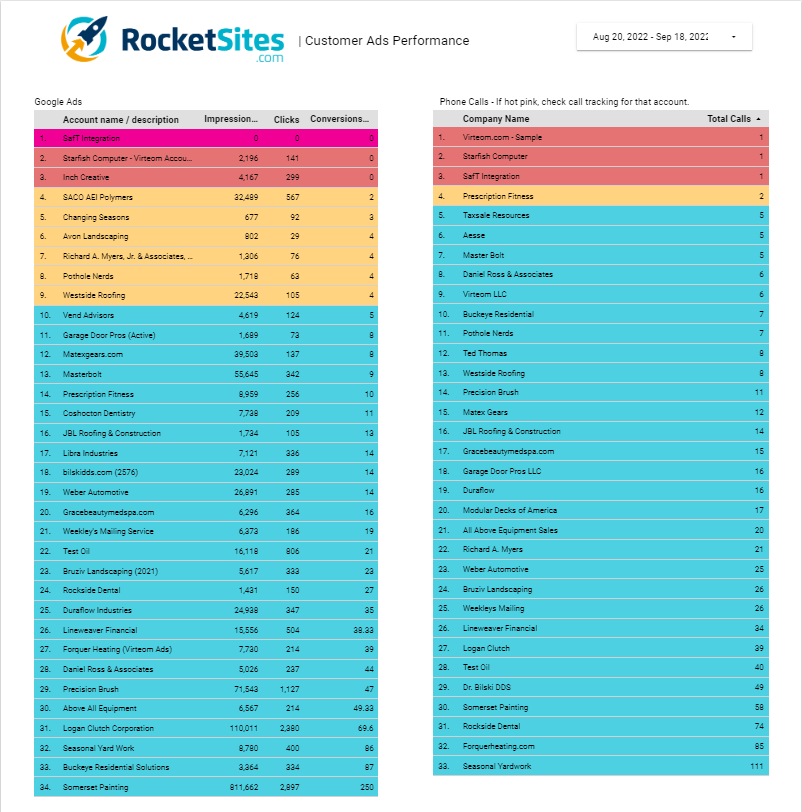
This is a report used to get a quick overview of how our Client's (Clients that either have an All-in-one or an ad booster) Google Ads are performing.
Left Column
The Left Column of the Report shows the status of a Clients Google Ads performance at a glance.
Notice that certain rows have different colors for the row's background-color. The table below will ellaborate on the meaning behind each color.
| This color represents the absolute worst case scenario for a client, it means that there are not only 0 conversions but 0 clicks as well. This could also mean that a client's ad campaigns have been paused. | |
| This color represents that a Client's ad campaigns have returned 0 conversions. | |
| This color represents that a Client's ad campaigns have returned at least 1 conversion. | |
| This color represents that a Client's ad campaigns have returned more than 4 conversions. |
Right Column
The Right Column of the Report shows the status of a Clients Callrail performance at a glance.
Notice that certain rows have different colors for the row's background-color. The table below will ellaborate on the meaning behind each color.
| This color represents that a Client's ad campaigns have resulted in 0 calls to the client. It is possible that the Callrail tracking number is not properly installed. | |
| This color represents that a Client's ad campaigns have resulted in 1 call to the client. | |
| This color represents that a Client's ad campaigns have resulted in 2 calls to the client. | |
| This color represents that a Client's ad campaigns have resulted in 3 or more calls to the client. |